
LUCY reads tissue by measuring autofluorescence lifetime.
Every type of tissue fluoresces when a short ultraviolet pulse of light hits it. The way that light decays over a split second depends on the tissue's biochemistry. LUCY measures that decay at every pixel and turns it into a map.
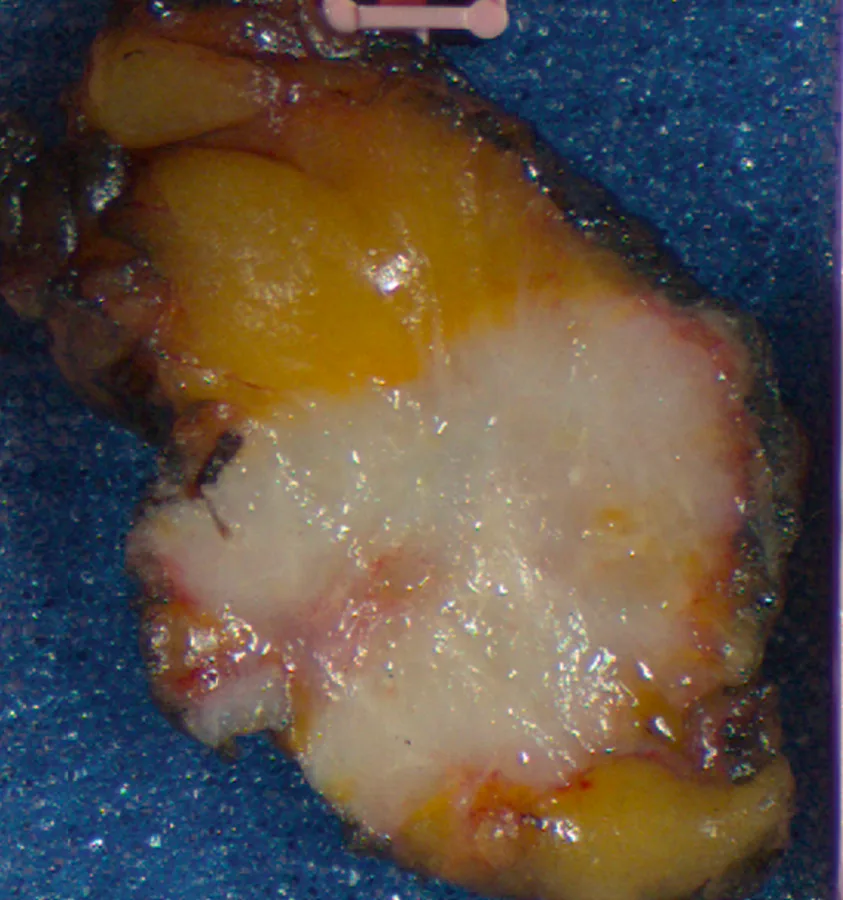
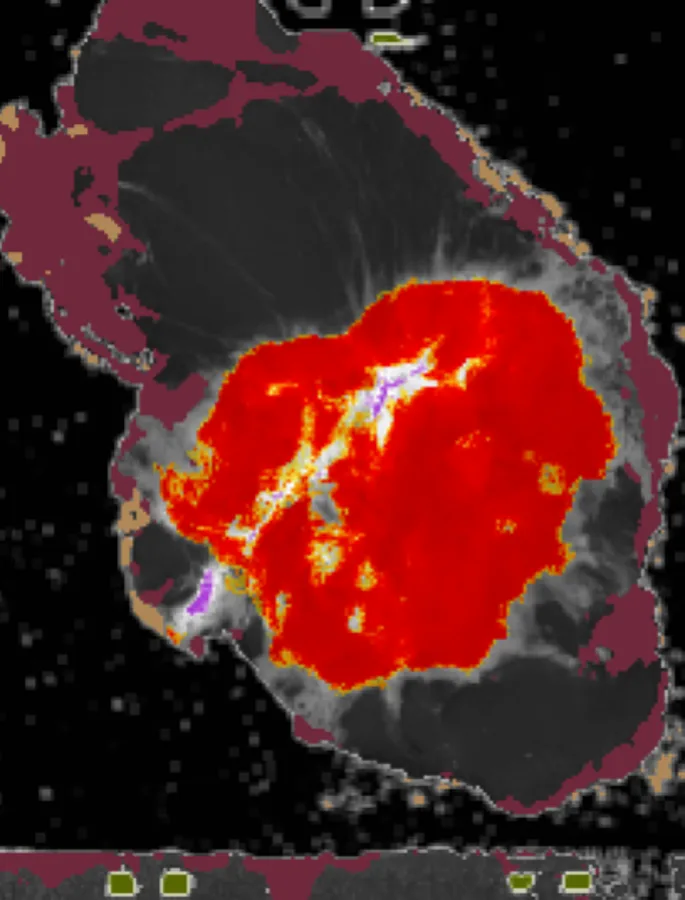
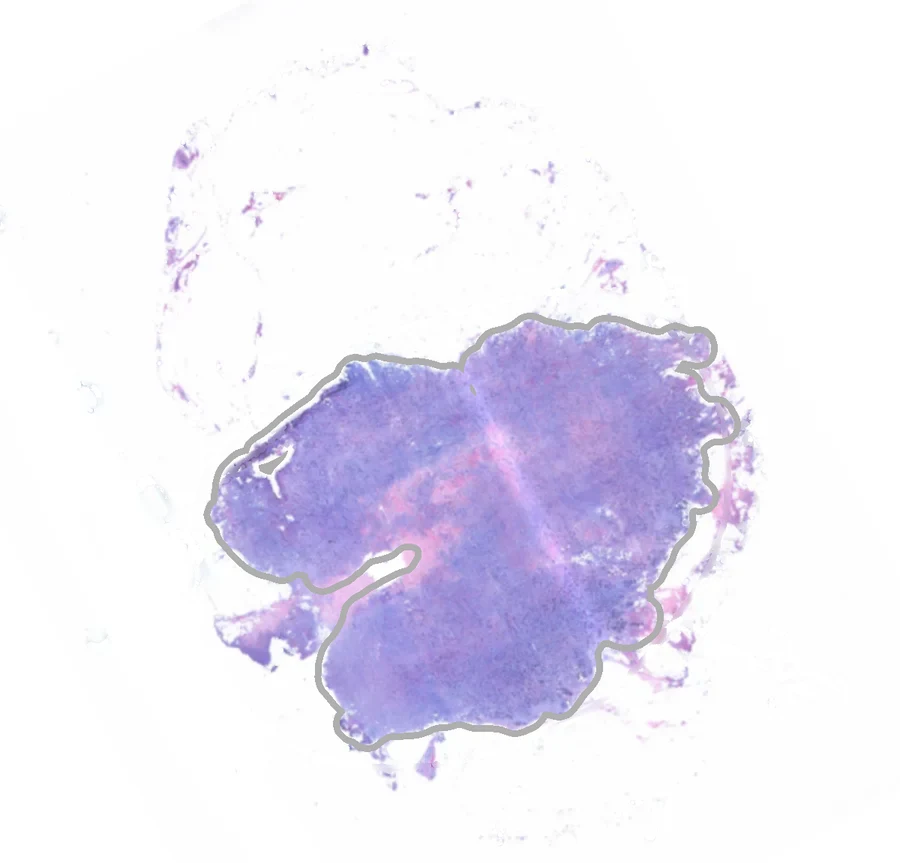
From a laser pulse to a map, in four steps.
- 1
Excite
An ultraviolet laser pulse lands on the specimen surface.
- 2
Emit
Molecules already in the tissue, mainly NAD(P)H, collagen and flavins, absorb the pulse and fluoresce. No dye is involved.
- 3
Record
The emission is split into multiple color bands and the full decay in each band is digitized with precise timing.
- 4
Classify
Parameters from the collected data are sent to an AI classifier model trained using pathology as ground truth. The result is a per-pixel map that the surgeon reads on screen.
Timing is more robust than brightness.
Fluorescence lifetime holds up in the operating room. Blood, saline and overhead lights change how bright the tissue looks, but not how fast its fluorescence decays. That decay time depends on the tissue's biochemistry, which is what changes in cancer.
LUCY uses the combined decay pattern across multiple color bands. The classifier learns which patterns correspond to tissue that a pathologist later marked as cancer, and which correspond to fat, fibrous tissue and normal glandular tissue.
The method is label-free. Nothing is injected, so there is no dosing, no waiting for a dye to distribute and no contrast-agent risk to the patient.
The fourth generation of fluorescence imaging.
Earlier generations read a dye or the spectrum alone. Only BlackLight reads how fast the tissue's own fluorescence decays.
Single-wavelength dye
Before 2000One wavelength, one monochrome image. A dye is required.
Near-infrared dye fusion
2000 to 2018One near-infrared channel fused onto the white-light image. Indocyanine green (ICG) dye is injected.
Autofluorescence spectra
2010 onwardNo dye. Captures the tissue's own fluorescence by wavelength.
Autofluorescence lifetime
Time-resolvedSpectrum plus fluorescence decay time, measured in picoseconds. No dye.
Quantitative: lifetime does not depend on dye concentration or signal brightness.
Biochemical: decay kinetics read tissue metabolism: NADH, FAD and collagen.
Robust: less affected by distance, angle and lighting than intensity.
Invented at Cedars-Sinai, protected by three patent families.
The technology grew out of a decade of time-resolved fluorescence research in the Department of Neurosurgery at Cedars-Sinai Medical Center. An earlier fiber-optic probe was tested during brain-tumor surgery; the lessons from that work shaped the scanning system now used for breast specimens. More than thirty granted patents worldwide, in three families, protect the platform.